It would be great to be able to see what devices and screen sizes already have been tested for a specific project version and project path (e.g. www.testing.com/blog).
This could be displayed in a table including the information whether the test contained issues or not.
As mentioned here, it would also be great to be able to see rough statistics about how much market share (in terms of devices currently used in a specific area) are covered by the testing results (would also be wonderful to be able to communicate this to clients).
Something along these lines:
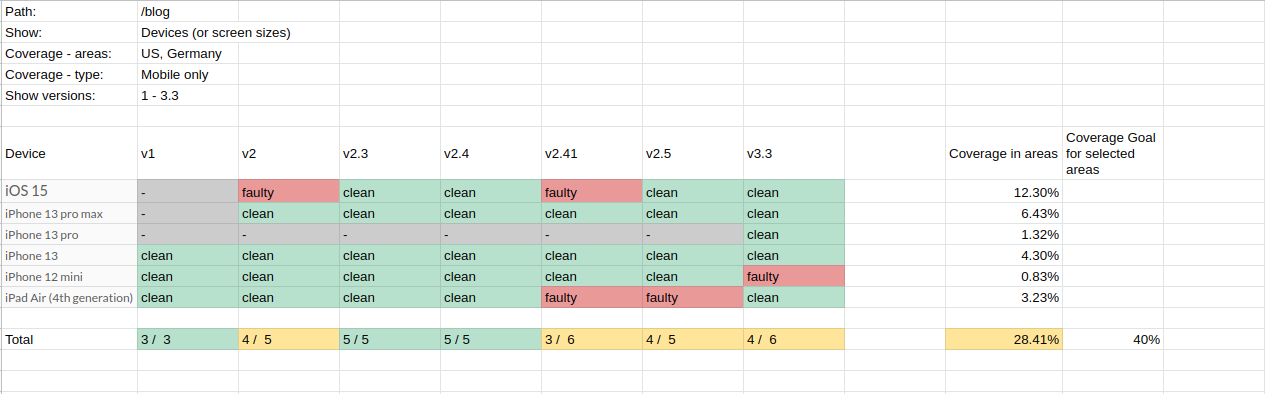
It could then also be summed up across various routes for a project and be shown for the current default project version of a project.
For the “faulty”, “clean” display, a feature would have to be added to toggle that state for a specific test.
Please mind, that “IOS15” in the screenshot above should of course be also just another device. It would be interesting though to be able to have the same overview regarding OS and especially screen sizes.