We have rolled out new features in Insights to help you optimize app performance and get deeper insights from your test data.
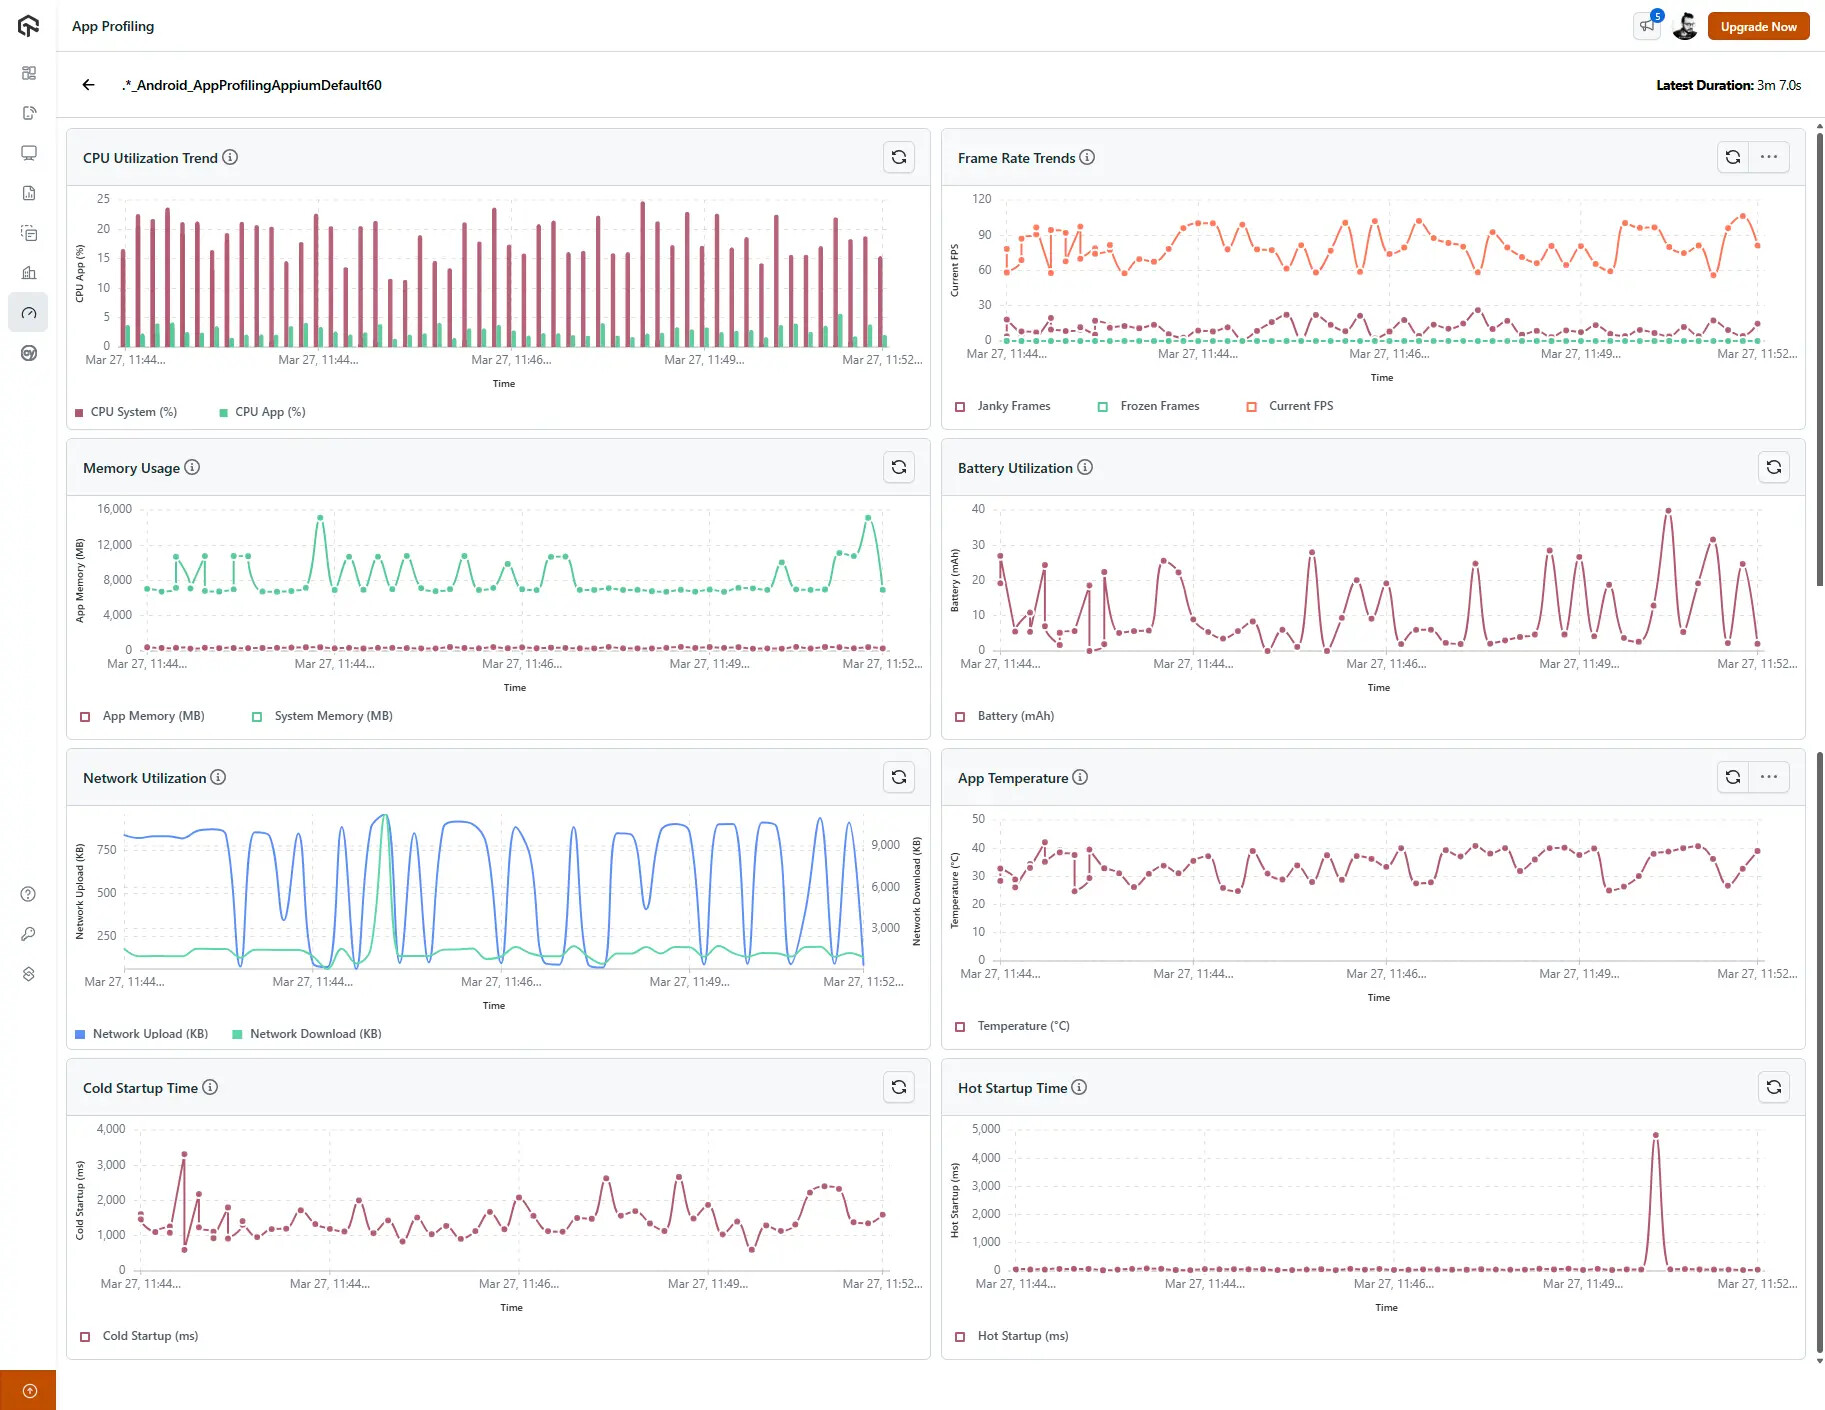
Monitor Performance in Real-Time With App Profiling Dashboard
The new App Profiling dashboard gives you a clear view of how your app behaves during tests on real devices. It tracks key performance metrics like CPU usage, frame rate, memory usage, battery consumption, and more.
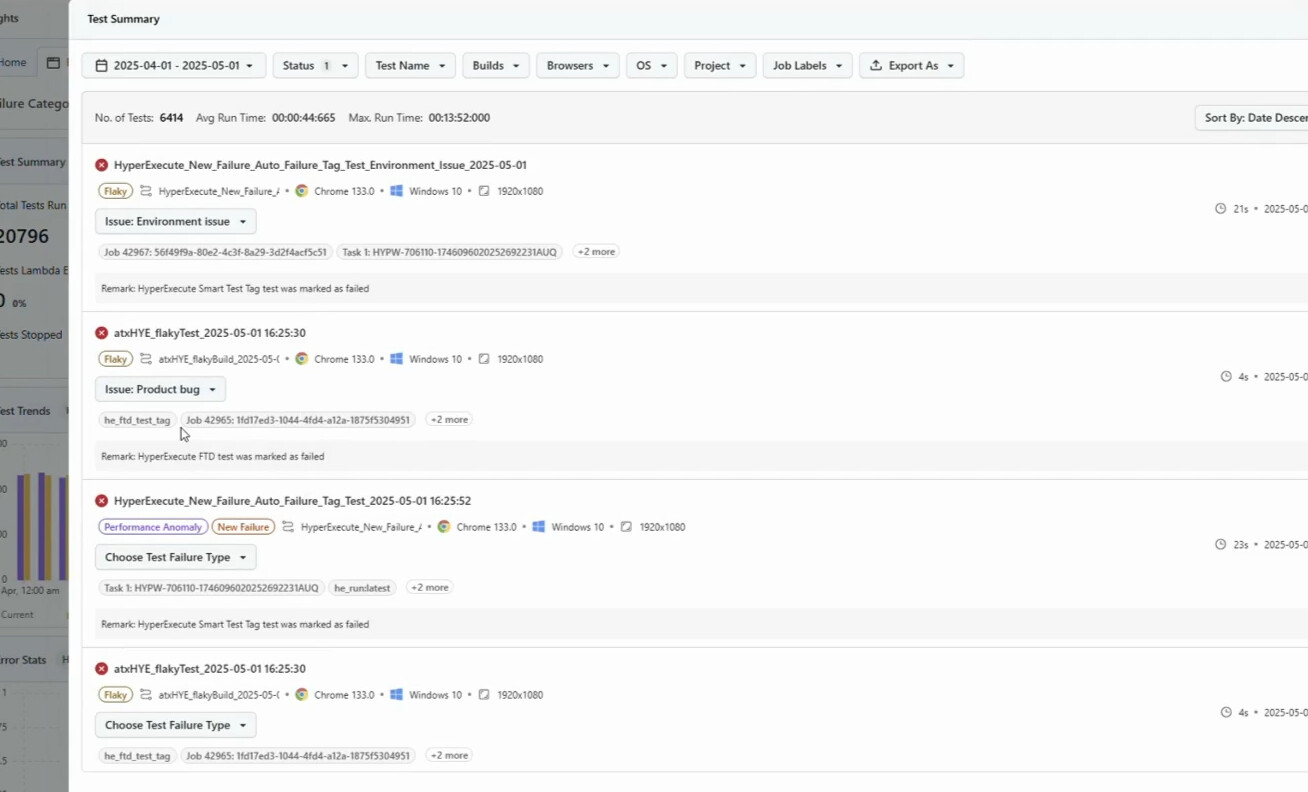
Categorize Test Failures With AI
Now identify test failures more efficently with an AI-native test failure categorization in Insights. It helps you to automatically group test failures based on environment, browser, operating systems, and error patterns.
Create Custom Dashboard Widgets
You can now build your own custom dashboard widgets in Insights. This feature gives you the flexibility to create the exact visualizations you need.
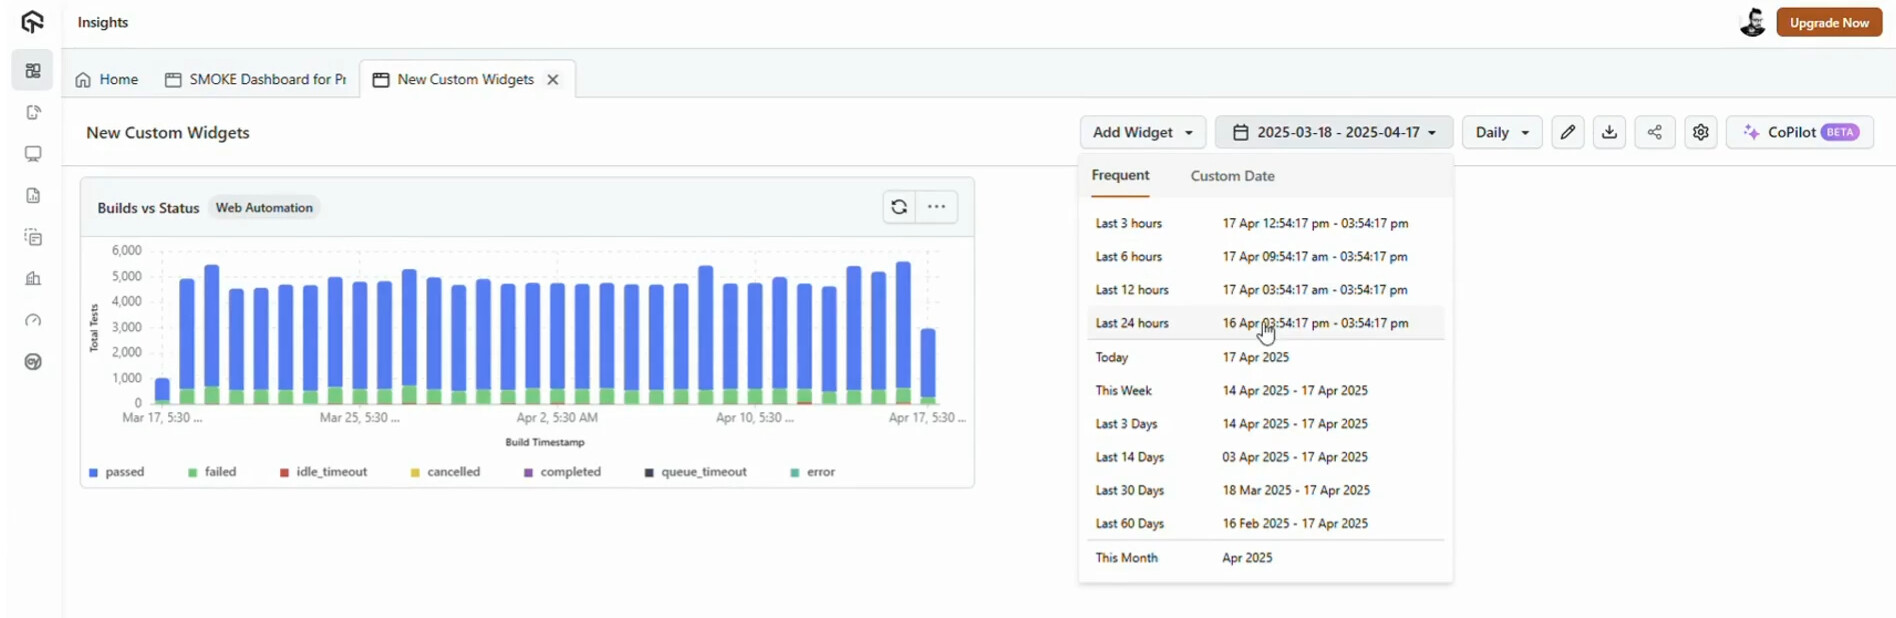
You can select any supported values for X and Y axes, organize data using your preferred group-by fields and apply multiple filter conditions to zero in on the right data.
Categorize Tests Using Smart Tags
Smart tags in Insights let you categorize tests using various parameters, providing a clearer view of your test execution. This helps uncover patterns, trends, and anomalies in results, making it easier to refine and optimize your test automation strategy.
Capture Test Case Insights for HyperExecute Using Playwright Reporter
You can now capture HyperExecute test case insights with Playwright reporter. This way, you can view detailed test case data directly in the Test Case Widgets on HyperExecute dashboard.